ASTER Price Analysis: Key Levels, Market Momentum, and What Comes Next
ASTER Current Price Overview
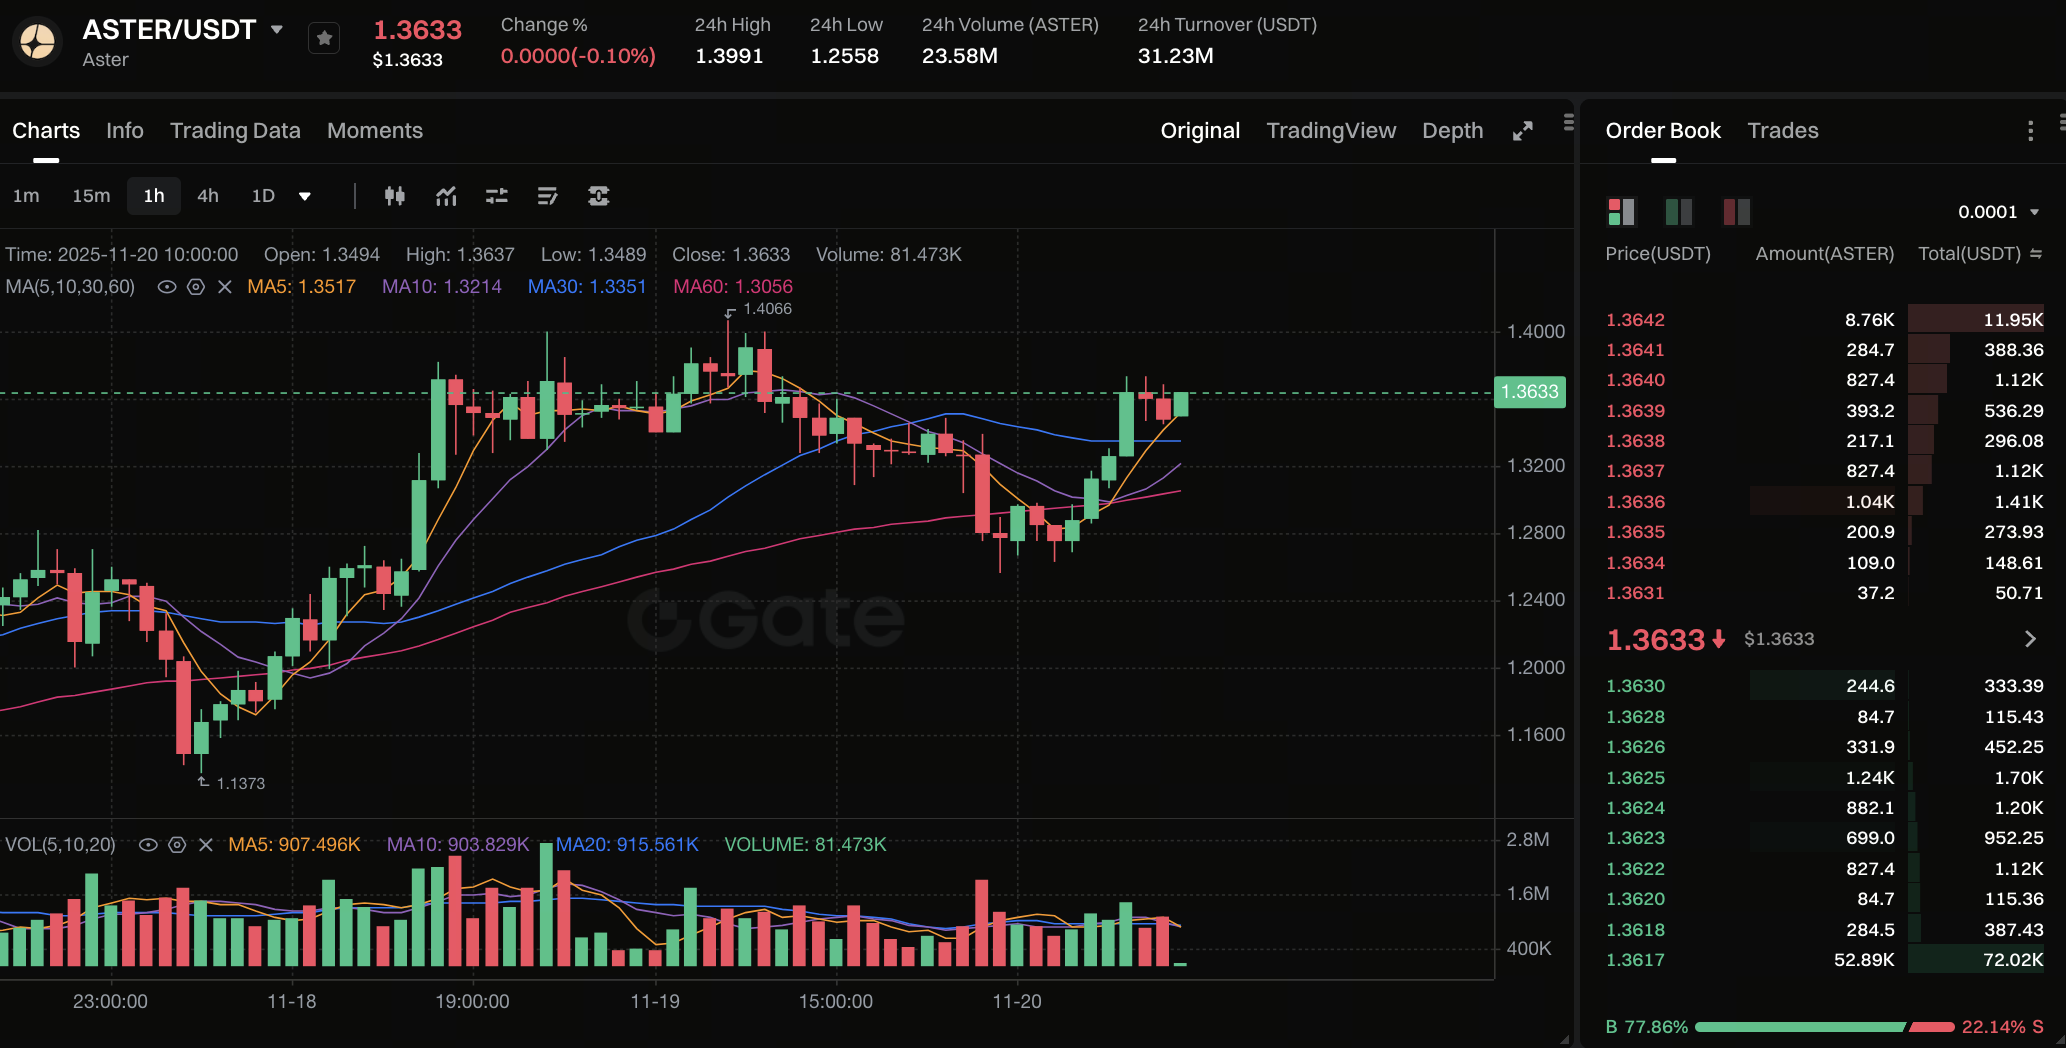
ASTER is currently trading in the US$1.30–US$1.40 range, showing signs of steady upward recovery after a prolonged correction. The token has regained positive momentum, supported by growing trading activity and improving sentiment within the ASTER ecosystem. Despite being down significantly from its all-time high, the recent price action reflects renewed interest and accumulation from both retail and larger market participants.
The price structure suggests that ASTER is entering a new short-term bullish phase, with traders focusing on whether it can sustain upward momentum and break through major resistance levels.
Recent Market Movements
Over the past few days, ASTER has shown:
Double-digit intraday gains, indicating strong buy pressure.
Increasing trading volume, often seen during the early stages of a trend reversal.
Momentum indicators such as MACD and RSI turning bullish, signaling renewed market confidence.
This price rebound follows a period of consolidation, where ASTER formed a stable base and began attracting attention from accumulation-focused investors. The shift in momentum marks one of the strongest short-term recoveries the token has seen in recent weeks.
Key Support and Resistance Levels
Understanding ASTER’s price structure requires focusing on several critical levels:
Resistance Levels
US$1.39 — The most important immediate resistance. A clean breakout above this level could trigger accelerated upward movement.
US$1.50 — A psychological round-number resistance, often acting as a major decision point for traders.
If ASTER breaks above these zones with strong volume, it may signal a continuation of its bullish recovery phase.
Support Levels
US$1.25 — The nearest key support zone. A retest and rebound from this level would be considered healthy.
US$1.10–US$1.15 — A deeper support region that may serve as a strong accumulation zone if the market experiences short-term corrections.
The overall trend remains constructive as long as ASTER stays above its mid-range support near US$1.20.
What Is Driving ASTER’s Price
1. Increasing Accumulation Activity
Market behavior indicates stronger buying interest from traders and potentially larger holders. Such accumulation often precedes sustained price moves.
2. Improving Market Sentiment
A more stable broader crypto environment and rising interest in newer tokens have contributed positively to ASTER’s performance.
3. Supply and Unlock Dynamics
ASTER still has a significant portion of tokens locked or vesting, meaning supply events can temporarily influence price volatility. Reduced sell-side pressure during non-unlock periods generally benefits upward movement.
4. Ecosystem Development
As ASTER’s product narrative strengthens and more integrations are added to the ecosystem, demand is likely to increase. Growing platform usage can reinforce price performance and attract long-term holders.
Short-Term and Mid-Term Trend Outlook
Short-Term (1–2 weeks)
A breakout above US$1.39 remains the key bullish trigger.
If achieved, ASTER could quickly retest US$1.50.
Consolidation between US$1.25 and US$1.35 is also possible before the next major move.
Short-term momentum indicators remain supportive of continued strength.
Mid-Term (1–2 months)
In the medium term, several outcomes are possible:
Bullish scenario: Sustained bullish momentum pushes ASTER toward US$1.60 and beyond.
Neutral scenario: ASTER trades in a wide sideways range between US$1.10 and US$1.50.
Bearish scenario: Failure of support levels could lead to a pullback toward the US$1.00 region.
Trend continuation depends heavily on whether ASTER can maintain its growth narrative, trading volume, and ecosystem expansion.
Potential Risks to Watch
Even with positive signs, several risks remain:
Token unlock schedules may introduce short-term sell pressure.
Market-wide volatility can influence ASTER regardless of fundamentals.
Competition from similar projects could affect user growth and capital flow.
Failure to break major resistance may lead to a loss of buying interest.
Investors should monitor these factors, especially around key price levels.
Final Thoughts
ASTER’s price is showing clear signs of recovery, backed by strong market participation and improving sentiment. The token is approaching a major breakout point, with US$1.39 being the most important short-term resistance. A strong breakout could open the door to higher targets such as US$1.50 or more.
While the trend appears favorable, price volatility is expected, especially around key support and resistance zones. Traders and investors should remain cautious, plan entries carefully, and monitor token unlocks and ecosystem updates.
Disclaimer:
This is not investment advice. This information is provided for informational purposes only and should not be construed as a recommendation to buy, sell, or hold any asset. Cryptocurrency trading involves a risk of loss. Gate US services may be restricted in certain jurisdictions. For more information, please see our legal disclosures: https://us.gate.com/legal/disclosures
Share
Content


Related Articles

Bitcoin Halving Chart: Key Dates, Trends, and Future Predictions

Bitcoin Halving Chart:Understanding the Changes in Bitcoin Supply and Price Trends

US December Rate Cut Forecast: Will the Federal Reserve Finally Pivot?

Federal Reserve Ends Quantitative Tightening — How the End of QT Could Reshape Global Markets in 2025

Midnight Network Ignites Cardano’s Next Chapter with NIGHT Token Mining and Privacy Innovation
