Bitcoin Falls Below $100,000 — What This Key Breakdown Means for the Market
BTC Below $100K: Why It Matters
Bitcoin (BTC) has officially dropped below the psychological level of $100,000, marking its lowest point since June. As of writing, BTC trades around $99,357, down 7.29% in 24 hours, with a 24h low at $98,951 and a high near $107,287.
The $100K zone has long been viewed as both a psychological benchmark and a technical support level. Once broken, it often signals a shift in short-term market sentiment — from confidence to caution.
Key Factors Behind the Drop
Three major factors appear to be driving this correction:
Weak macroeconomic sentiment
Rising interest rates, tightening liquidity, and renewed concerns about global growth are pressuring risk assets — especially Bitcoin, which often behaves like a “digital high-beta” macro asset.
Over-leveraged positions and liquidations
Data shows that more than $1 billion worth of leveraged long positions have been liquidated across major exchanges. When Bitcoin fails to hold a key support like $100K, these cascading liquidations intensify selling momentum.
Technical breakdowns and profit-taking
After weeks hovering between $110K and $125K, BTC faced heavy resistance around $112K. The failure to break higher triggered short-term traders to lock in profits, adding further downside pressure.
Technical Analysis: What Charts Reveal
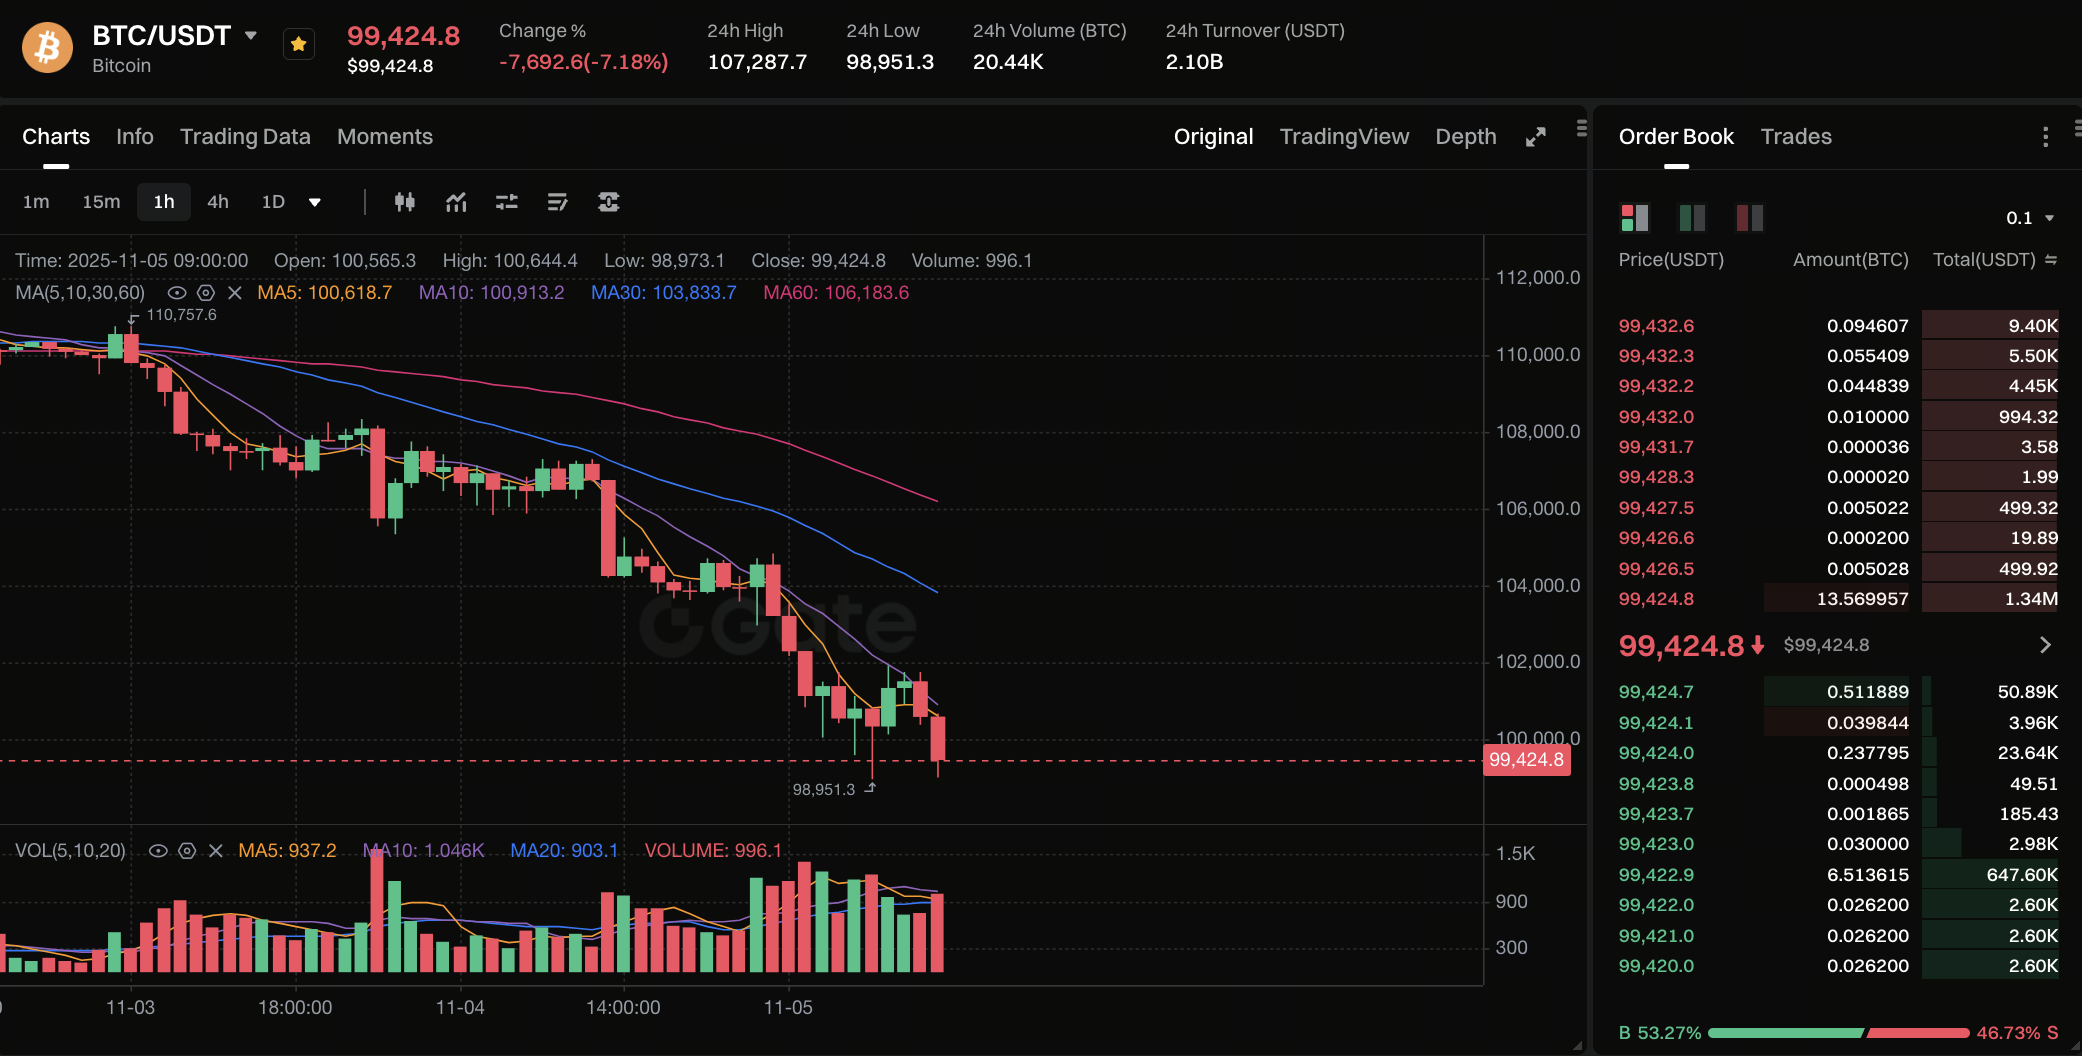
Looking at the BTC/USDT 1-hour chart, we can clearly see that Bitcoin is in a short-term downtrend, with strong bearish momentum dominating the session.
Trend Overview
Current Price: $99,357
24-hour Range: $98,951 – $107,287
Volume: 904 BTC (24h turnover $2.09B USDT)
Moving Averages
All key moving averages are sloping downward:
MA5: $100,605
MA10: $100,906
MA30: $103,831
MA60: $106,182
This alignment — known as a bearish MA stack — signals that momentum remains negative. The short-term MA5 and MA10 are both below the longer-term averages, indicating sellers are still in control.
Candlestick Structure
The hourly candles form a descending channel, with each rebound capped by declining MAs. Despite several attempts to hold above $100K, each bounce was met with strong sell volume, reinforcing the bearish bias.
Volume Analysis
Volume spikes on red candles suggest capitulation selling, especially around the $99K and $98.9K zones. The most recent volume bar shows a small rebound, but not enough to confirm a bottom.
Support and Resistance
Immediate Support: $98,900 (if broken, next zone $97,000)
Immediate Resistance: $101,000 – $102,500
Mid-term Resistance: MA60 near $106,200
Momentum Indicators (estimated)
MACD: Negative, with the signal line crossing below zero — continued bearish momentum.
RSI (1-hour): Around 35–40, showing short-term oversold conditions but no clear reversal yet.
Conclusion:Unless BTC regains the $101K–$102K range and sustains volume confirmation, the short-term trend remains weak. A clean move above the MA10 would be the first sign of stabilization.
What This Means for New Investors
For beginners, this correction might look frightening — but it’s also an opportunity to understand how market structure behaves around major levels.
Don’t panic-sell: Sharp drops are common in crypto; emotional trading often leads to losses.
Understand volatility: A 5–10% swing in Bitcoin is normal, especially after long rallies.
Focus on trends, not just numbers: The $100K mark is symbolic, but the real key is whether BTC can build a higher low in the coming days.
Diversify exposure: Keep some funds in stablecoins to avoid forced losses during corrections.
Strategy and Market Outlook
Here are a few practical steps for investors navigating this environment:
Short-Term Traders
Watch for a rebound test toward $101K–$102K; this zone could offer a short-term trading setup.
Maintain stop-loss orders below $98,500 to manage downside risk.
Medium-Term Holders
Avoid panic decisions. Instead, track whether BTC forms a base near $98K–$99K.
Consider re-entry once BTC confirms a move above the MA10 ($100,900).
Long-Term Investors
Use this correction as a dollar-cost averaging (DCA) opportunity.
Historical data shows Bitcoin tends to recover strongly after major sentiment washouts, especially near strong psychological levels.
In the broader picture, Bitcoin’s fundamental demand remains robust — institutional inflows, ETF exposure, and halving expectations in 2026 still support a long-term bullish narrative.
Summary
Bitcoin’s fall below $100,000 is more than just a round number headline — it’s a reminder of how quickly sentiment shifts in crypto.
Technically, BTC is in a short-term downtrend, with all major moving averages pointing lower and volume favoring sellers. However, oversold signals are emerging, suggesting the possibility of a near-term bounce if $98,900 holds.
For new investors, the key takeaway is clear:
Stay calm.
Manage risk.
Let the trend confirm before making bold moves.
As the saying goes in crypto: “Volatility is not risk — unpreparedness is.”Those who plan ahead and understand the charts will find that even sharp drops can become long-term opportunities.
Share
Content


Related Articles

Bitcoin Halving Chart: Key Dates, Trends, and Future Predictions

Bitcoin Halving Chart:Understanding the Changes in Bitcoin Supply and Price Trends

US December Rate Cut Forecast: Will the Federal Reserve Finally Pivot?

Federal Reserve Ends Quantitative Tightening — How the End of QT Could Reshape Global Markets in 2025

Midnight Network Ignites Cardano’s Next Chapter with NIGHT Token Mining and Privacy Innovation
