Is the Bull Market Back? Bitcoin Rebounds to $90,000 — Did You Buy the Bottom?
Bitcoin’s price has once again captured global attention as it rallied sharply and returned to the $90,000 level. After a period of extended consolidation and short-term weakness, this sudden reversal has reignited discussions about whether the next bull market may already be underway. The question now circulating through trading groups is simple: “Did you buy the bottom?”
To understand whether Bitcoin is entering a new bullish phase, we need to examine the momentum behind the rebound, market psychology, and the broader structural trends influencing its price.
Bitcoin Reclaims $90,000: What Is Driving the Rally?
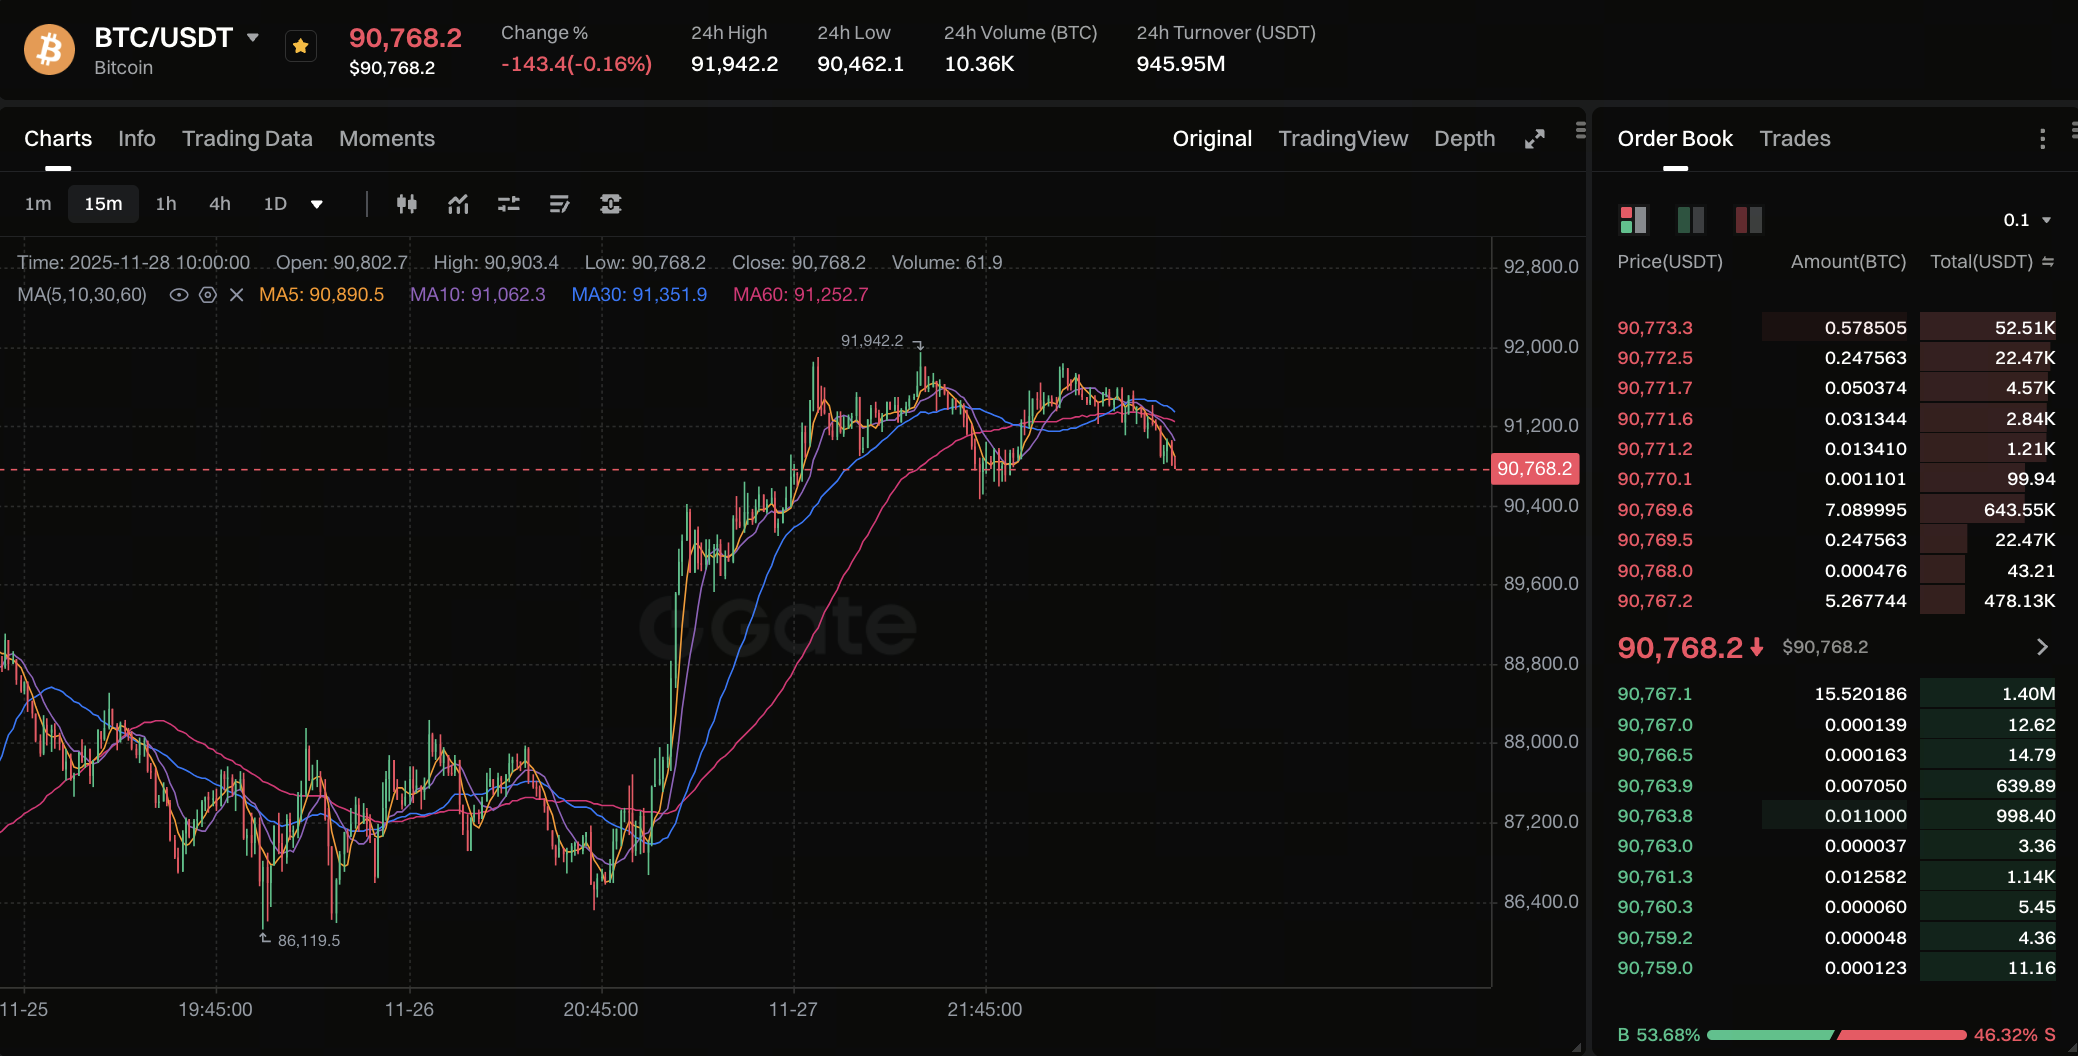
The latest price action shows a strong V-shaped recovery, with Bitcoin climbing from near-term lows around the mid-$80,000 range and quickly reclaiming $90,000. Multiple attempts to break above this level indicate a shift in buyers’ strength and an improvement in market confidence.
What makes this rebound notable is not just the price itself, but the speed and conviction behind the move. After a period of hesitation, traders are now returning to risk assets, and Bitcoin has once again become the leading beneficiary.
Three Key Forces Behind Bitcoin’s Recent Surge
Bitcoin’s rebound is not random. Three clear forces are pushing the price upward:
1.Improving Macro Conditions
A shift in economic expectations—especially regarding interest rates and liquidity—has made risk assets more attractive again. Investors are increasingly anticipating a friendlier macro environment, and Bitcoin often reacts first to such changes.
2.Short Squeeze Dynamics
Throughout the recent downturn, short sellers accumulated positions, expecting deeper corrections. As soon as Bitcoin moved upward:
Short positions were forced to close
Algorithmic trading systems triggered buy orders
Liquidations created additional upward pressure
This accelerated the rally and made the breakout more dramatic.
3.Long-Term Accumulation Strengthened the Floor
Long-term holders and institutional-sized wallets continued accumulating during the decline. This created a strong demand zone on the chart and made any sustained drop less likely. When Bitcoin eventually rebounded, the presence of strong buyers helped maintain momentum.
Did You Actually Buy the Bottom?
Many traders now question whether they managed to buy the bottom.
However, bottoms are rarely obvious in real time. To evaluate whether you bought near the lows, consider the following:
Sentiment Analysis
The bottom typically forms when fear is highest and the majority expects more downside. If you entered the market while others were panicking, you likely bought close to the bottom range.
On-Chain Patterns
During the decline, long-term wallets absorbed large amounts of Bitcoin while short-term sellers exited. This behavior often defines bottom zones.
Volume Shifts
Bottoms often form on high-volume capitulation followed by steady accumulation. If your entry matched this behavior, your position is likely strong.
You do not need to catch the absolute lowest candle—being within the accumulation range is what matters.
Is This a Real Bull Market or Just a Temporary Bounce?
This question is critical. A rebound does not automatically mean a new bull market has begun. Several factors determine whether this move can evolve into a sustained uptrend.
Signs of a Real Bull Market:
Higher highs and higher lows consistently forming
Rising trading volume during rallies
Investors buying dips instead of panic-selling
Momentum extending beyond short-term events
Signs of a Temporary Bounce:
Weak volume behind the rise
Heavy selling pressure at resistance levels
Price unable to maintain support after quick surges
Market sentiment shifting too quickly into euphoria
Currently, Bitcoin’s behavior suggests potential, but confirmation requires breaking key levels above $95,000 and holding them firmly.
Bitcoin’s Possible Price Paths in the Coming Weeks
Bitcoin now stands at a crossroads, and several scenarios are possible.
Scenario A: Bullish Extension Toward $95,000–$100,000
If buyers maintain control and trading volume rises, Bitcoin could test the psychological $100,000 level. A breakout from that zone would likely generate strong global FOMO.
Scenario B: Sideways Consolidation
Bitcoin may oscillate between $87,000 and $92,000 before choosing a long-term direction. This would actually be healthy, as it allows the market to absorb volatility.
Scenario C: Pullback to Retest Support
If momentum cools or profit-taking increases, Bitcoin could retest the $85,000–$88,000 range. Such a move would not invalidate the bullish structure unless deeper levels are broken.
How Investors Should Position Themselves Now
Regardless of whether this marks the next bull run or a temporary bounce, investors can navigate the market more effectively by following a few principles:
Avoid Emotional Trading
Chasing green candles or selling during fear often leads to poor decisions.
Use a Layered Entry Strategy
Buying in stages—rather than all at once—helps reduce risk and take advantage of volatility.
Set Realistic Targets and Stop-Losses
Define your plan before entering a trade and stick to it.
Focus on Trend, Not Noise
Bitcoin always experiences short-term fluctuations. Long-term structure matters more than single-day moves.
Share
Content


Related Articles

Bitcoin Halving Chart: Key Dates, Trends, and Future Predictions

Bitcoin Halving Chart:Understanding the Changes in Bitcoin Supply and Price Trends

US December Rate Cut Forecast: Will the Federal Reserve Finally Pivot?

Federal Reserve Ends Quantitative Tightening — How the End of QT Could Reshape Global Markets in 2025

Midnight Network Ignites Cardano’s Next Chapter with NIGHT Token Mining and Privacy Innovation
