Trade
Trading Type
Spot
Trade crypto freely
Alpha
Points
Get promising tokens in streamlined on-chain trading
Pre-Market
Trade new tokens before they are officially listed
Margin
Magnify your profit with leverage
Convert & Block Trading
0 Fees
Trade any size with no fees and no slippage
Leveraged Tokens
Get exposure to leveraged positions simply
Futures
Futures
Hundreds of contracts settled in USDT or BTC
Options
HOT
Trade European-style vanilla options
Unified Account
Maximize your capital efficiency
Demo Trading
Futures Kickoff
Get prepared for your futures trading
Futures Events
Participate in events to win generous rewards
Demo Trading
Use virtual funds to experience risk-free trading
Earn
Launch
Investment
Simple Earn
VIP
Earn interests with idle tokens
Auto-Invest
Auto-invest on a regular basis
Dual Investment
Buy low and sell high to take profits from price fluctuations
Quant Fund
VIP
Top asset management team helps you profit without hassle
Crypto Loan
0 Fees
Pledge one crypto to borrow another
Lending Center
One-Stop Lending Hub
VIP Wealth Hub
New
Customized wealth management empowers your assets growth
Staking
Stake cryptos to earn in PoS products
BTC Staking
HOT
Stake BTC and earn 10% APR
ETH Staking
HOT
Stake ETH and earn 10% APR
GUSD Minting
New
Use USDT/USDC to mint GUSD for treasury-level yields
Soft Staking
Earn rewards with flexible staking
More


- Trending TopicsView More
30.3K Popularity
4.7M Popularity
129K Popularity
79.7K Popularity
164.8K Popularity
- Pin
- 🍁 Golden Autumn, Big Prizes Await!
Gate Square Growth Points Lucky Draw Carnival Round 1️⃣ 3️⃣ Is Now Live!
🎁 Prize pool over $15,000+, iPhone 17 Pro Max, Gate exclusive Merch and more awaits you!
👉 Draw now: https://www.gate.com/activities/pointprize/?now_period=13&refUid=13129053
💡 How to earn more Growth Points for extra chances?
1️⃣ Go to [Square], tap the icon next to your avatar to enter [Community Center]
2️⃣ Complete daily tasks like posting, commenting, liking, and chatting to rack up points!
🍀 100% win rate — you’ll never walk away empty-handed. Try your luck today!
Details: ht - 💥 Gate Square Event: #Post0GWinUSDT# 💥
Post original content on Gate Square related to 0G or the ongoing campaigns (Earn, CandyDrop, or Contract Trading Competition) for a chance to share 200 USDT rewards!
📅 Event Period: Sept 25, 2025, 18:00 – Oct 2, 2025, 16:00 UTC
📌 Related Campaigns:
Earn: Enjoy stable earnings
👉 https://www.gate.com/announcements/article/47290
CandyDrop: Claim 0G rewards
👉 https://www.gate.com/announcements/article/47286
Contract Trading Competition: Trade to win prizes
👉 https://www.gate.com/announcements/article/47221
📌 How to Participate:
1️⃣ Post original cont - 🚀 #GateNewbieVillageEpisode2# ✖️ @独领风骚必暴富
💰 Share your first profit on Gate | 🎉 Recall your most unexpected gain | 🤝 Grow with the community
⏰ Event Date:Sept 24 04:00 – Sept 30 16:00 UTC+8
How to Join:
1️⃣ Follow Gate_Square + @独领风骚必暴富
2️⃣ Post on Gate Square with the hashtag #GateNewbieVillageEpisode2#
3️⃣ Share your first pot of gold or your most surprising profit on Gate—more detailed and interesting posts have a higher chance to win!
🎁 Rewards
3 lucky winners → Gate X RedBull Tumbler + $20 Futures Trial Voucher
If merchandise cannot be shipped, it will be replaced with a $30 Futures - 🚗 #GateSquareCommunityChallenge# Round 2 — Which coin is not listed on Gate Launchpad❓
Time to prove if you’re a true Gate veteran!
💰 Join the challenge — 5 lucky winners will share $50 in GT!
👉 How to participate:
1️⃣ Follow Gate_Square
2️⃣ Like this post
3️⃣ Comment with your answer
🗓️ Deadline: October 8, 2025, 24:00 (UTC+8) - 🥊 You’ve entered the Trading PK Arena, matching your opponent now...
One click to place an order and jump into the battle! Who will climb the leaderboard and claim the 👑?
Gate’s brand-new Indicators Radar feature is live! Here you can:
📈 Share your trades on the live candlestick chart to [Square] 👉️ https://www.gate.com/post
👀 Watch others’ trading moves in real time;
💬 Go head-to-head with fellow traders in the community!
Don’t just read—follow the tutorial below and get started 👇
📌 Note: This feature is available only on app version 7.20.5 or above.
Bitcoin to start a bigger correction at this level, according to analyst
As Bitcoin (BTC) lingers below the $110,000 mark, a trading analyst has warned that the asset may be facing a deeper correction if certain levels are breached.
According to Analysis by Ted Pillows, after a recent decline from resistance above $113,000, the cryptocurrency is holding within a critical support zone
Analysis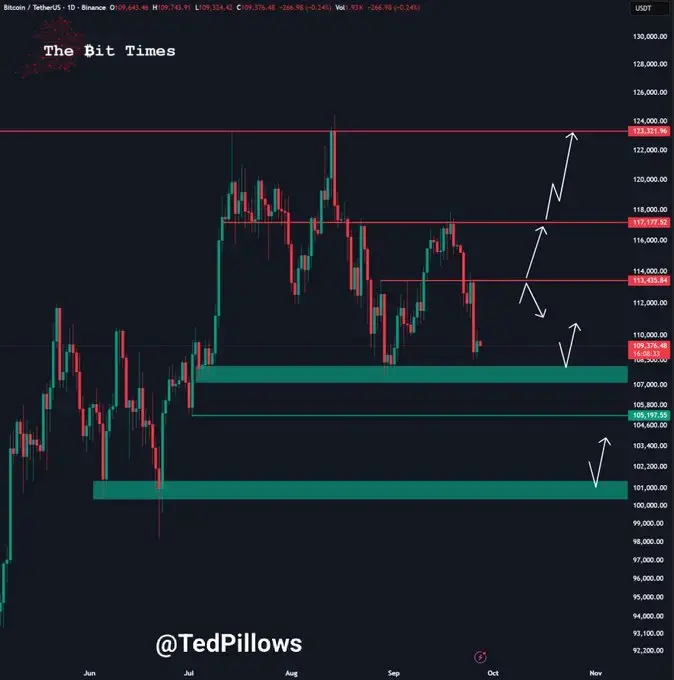 Bitcoin price analysis chart. Source: Ted Pillows**Bitcoin price analysis chart. Source: Ted PillowsThe outlook suggests that $112,000 remains a key level for bulls, as reclaiming it could trigger a fresh uptrend toward $118,000 and potentially retest the $123,000–$124,000 region.
On the downside, immediate support lies around $107,000, where failure to hold could confirm the start of a broader correction
A break below this level would expose the next major support cluster near $105,000, extending down to $101,000, signaling a deeper retracement.
Notably, Bitcoin’s current price action highlights indecision, with the asset consolidating in a narrow range as traders weigh whether momentum will shift upward or give way to stronger selling pressure
Therefore, a decisive move above $112,000 or below $107,000 is likely to set the tone for the coming weeks, with volatility expected to build as these thresholds are tested.
Bitcoin price analysis
At press time, Bitcoin was trading at $109,386, down 0.11% in the past 24 hours and nearly 6% lower on the weekly chart
Meanwhile, the 14-day RSI at 37.81 reflects bearish momentum, edging closer to oversold territory
While sellers remain in control, the indicator suggests Bitcoin could soon enter a zone where buyers step in to defend key support levels. For any sustained upward move, the asset must reclaim the $110,000 level.
Featured image via Shutterstock
Featured image via ShutterstockFeatured image via Shutterstock