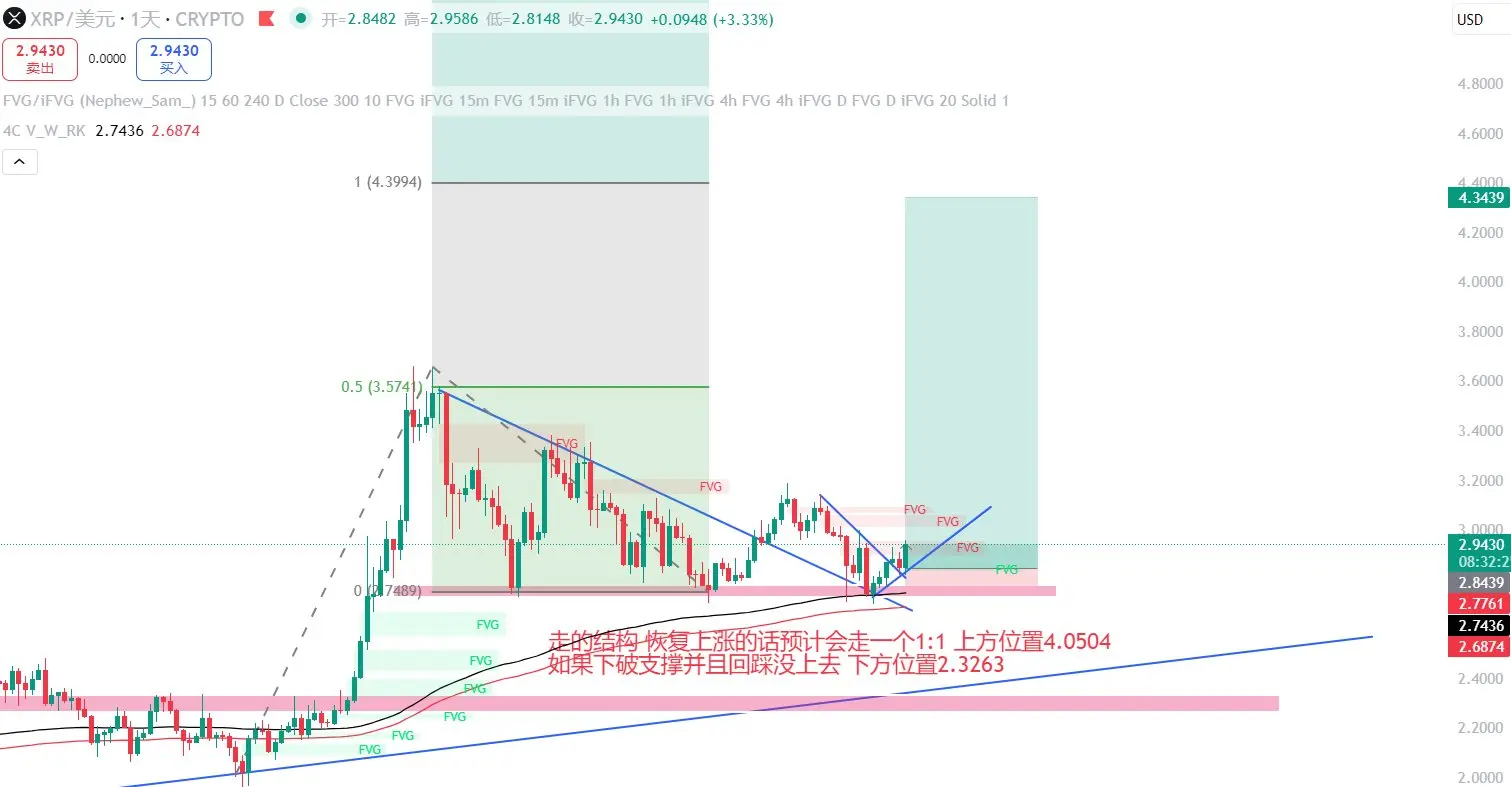
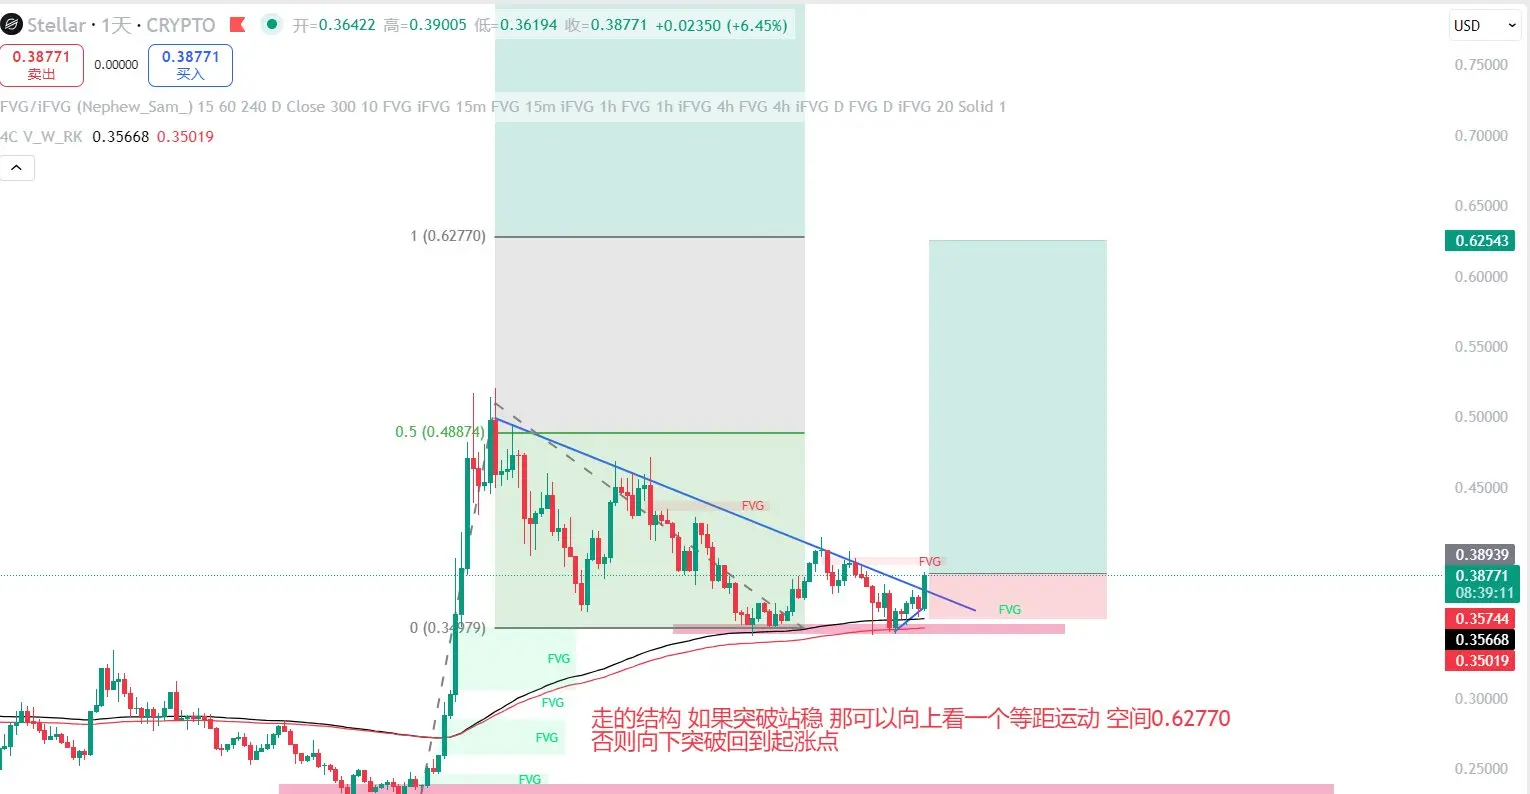
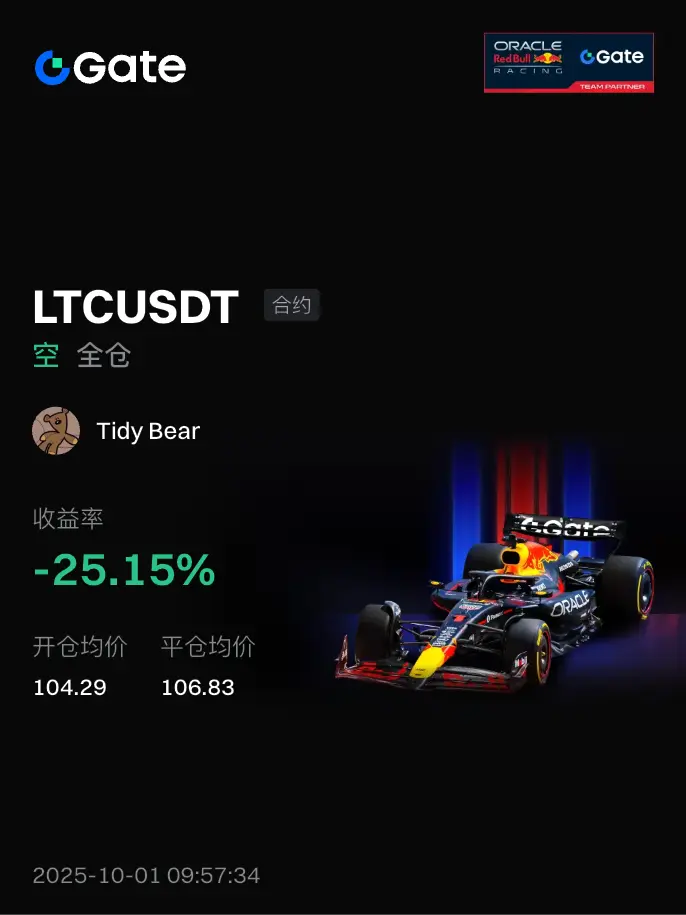
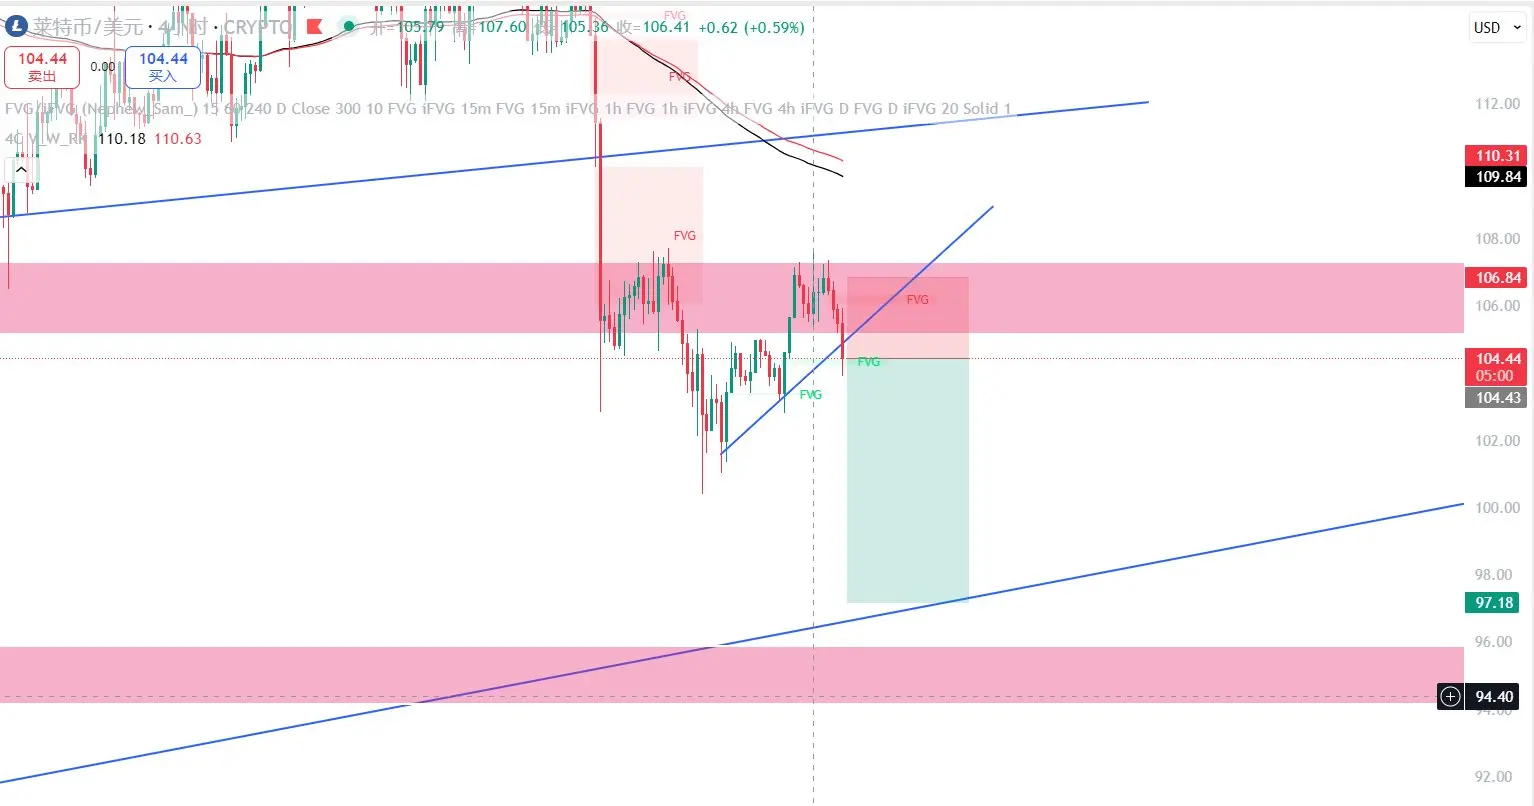
$LTC market trading plan analysis shows a similar head and shoulders pattern on the daily chart. Currently, following the market's pullback, is it a reversal or a pullback? The main focus is on the current short upward trend line. Looking closely at the four-hour chart, if it breaks below this upward trend line, we can look for an opportunity to take profit at a head and shoulders 1:1 position, targeting around 97. If it does not break below and returns to the upper trend line, it is considered a reversal, and we will look for opportunities to go long. After twelve o'clock, if it breaks the trend line, we will place a short order. If you are interested in $sol and $ltc , feel free to like and follow.